Monitor & measure bookfluencers per publisher
Lit-X Monitor & measure bookfluencers per publisher provides you with a publisher-centric view into what's happening internationally on all major social media platforms incl. TikTok, Instagram, and YouTube.
Lit-X Monitor & measure bookfluencers per publisher allows you to easily monitor which bookfluencers are talking about you as a publisher in terms of your authors or titles. Similarly, you can use the same function to understand how present your competition is amongst bookfluencers. Through this, you can learn which bookfluencers picked you up organically, in addition to those you actively hired. And, since you see all bookfluencer mentions with aggregated reach and engagement, you can track whether or not you achieved your latest campaign targets like reach, engagement, or cost-per-impression, for a specific title.
Lit-X has partnered with PONDUS, a leading publishing software provider, to seamlessly integrate its bookfluencer tools into the PONDUS RADAR platform. This collaboration will merge Lit-X's data expertise with PONDUS’s publisher data and features, creating powerful new capabilities for publishers. The goal is to deliver enhanced, data-driven solutions that will offer greater insights and efficiency for customers, helping publishers unlock fresh use cases and optimize their workflows.
This use case is currently available only on the Lit-X platform.
You can get multiple tasks done with the same use case
Using the tool is simple, you get your results easily & fast
Book an introduction now, we'll give you a walkthrough
Just book an introduction and we explain everything step-by-step and at your pace. We provide details and background, dive into the methodology and technology, share implementation best practices and support you along the way towards AI- and data-driven working.
This is how the use case looks like
-
The full Monitor & measure bookfluencers per publisher dashboard allows you to understand which boofluencers talk about your authors and titles, understand which bookfluencers talk about your publisher competition, identify bookfluencers talking about your authors and titles organically, check if you reached your campaign's reach, engagement, or cost-per-impression target.
-
You can filter the data you look at by publisher, author, title, social media platform, country of origin of the boofkluencer, channel, and release date of videos. This allows you to tailor the data to your needs and enables efficient working.
-
You can see the aggregated reach of the selected data, e.g., you as a publisher, over time and platform-specific specific. This allows you to gain a good perspective on how present you are as a publisher. Also, you see which channels, or bookfluencers, contribute most to these aggregated values. You can easily see who are the most influential bookfluencers for you, or your competition.
-
If you dive deeper, you can check which of your titles were mentioned by bookfluencers and how much that contributed to your overall performance. You can even see which bookfluencers spoke about those titles, in which videos and with what reach and engagement.
The tool offers convenient features to save time

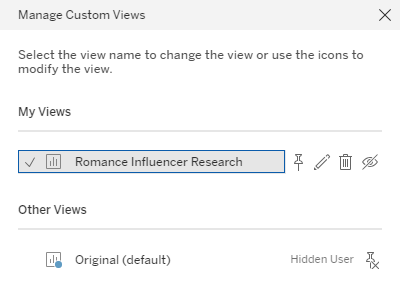
Save different views
Once set filters can be saved in individual views. This allows you to define various applications for yourself which you can easily access with one click. You can jump between views, e.g., "Find German TikTok bookfluencers in Romance" and "Find American Youtube bookfluencers in Young Adult"

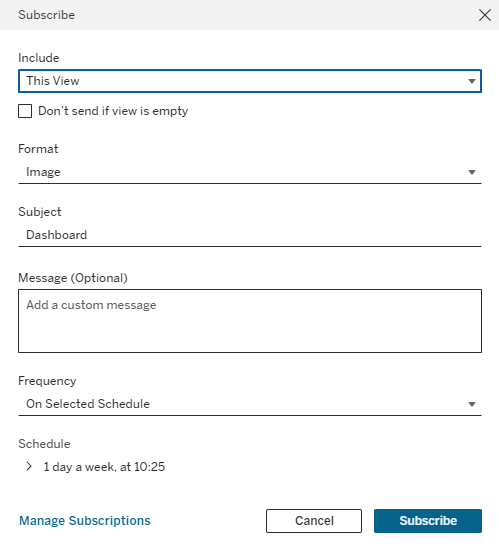
Subscribe to updates
You can define e-mail subscriptions for any view you saved. The e-mail contains a PDF or screenshot of the dashboard with your selected view. You can choose how often you want to receive those subscription e-mails and manage them at any time. This helps you to get a quick overview "has anything changed"? And if so, jump into the tool to dive deeper.

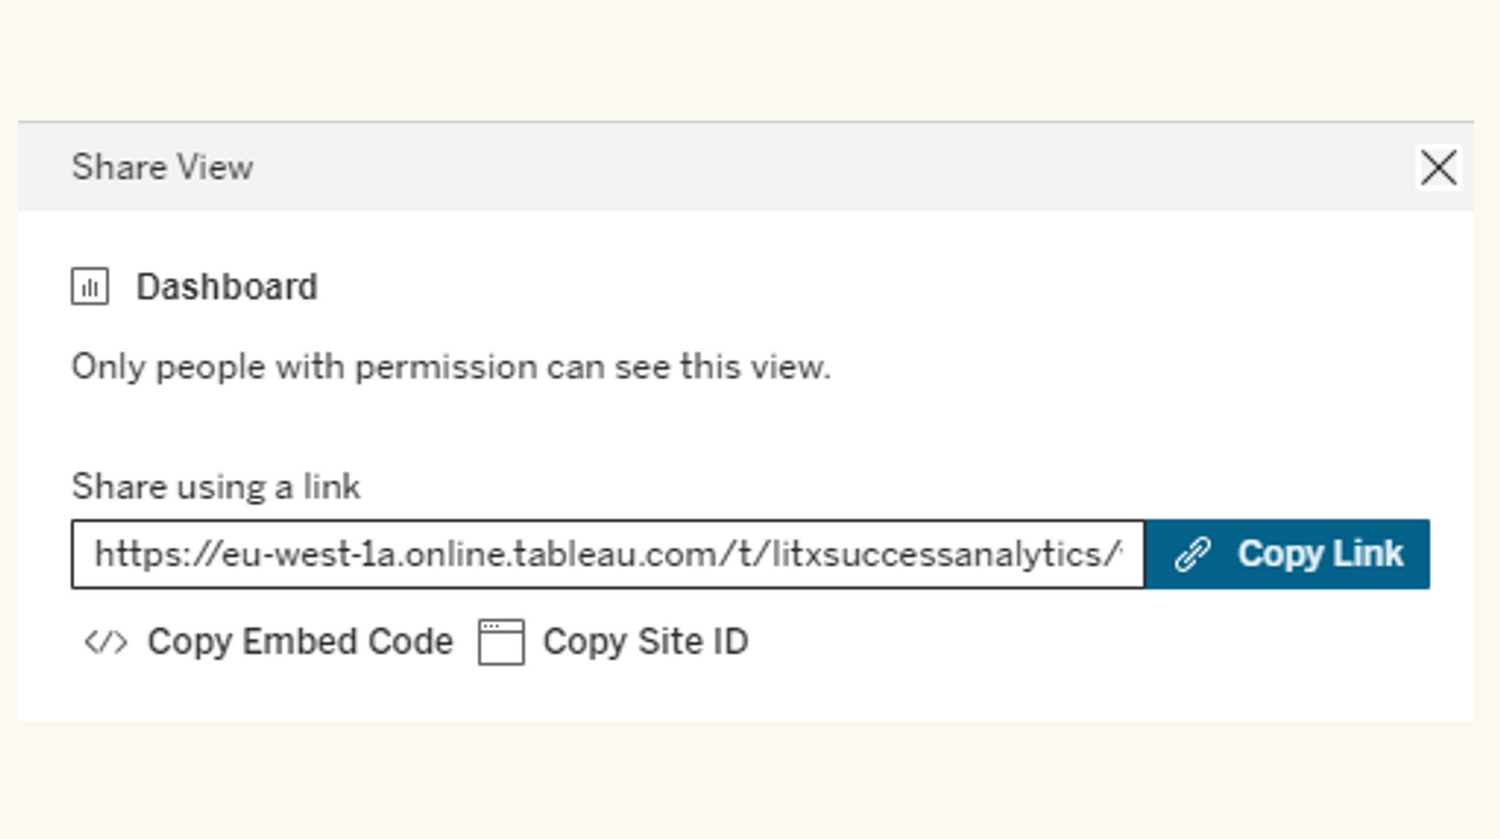
Share with colleagues
You can share any saved view with other licensed colleagues to collaborate on a project. Start a data-driven conversation, provide argumentation for a request or help them out with their own assignments.
The use case provides you with everything you need
Collapsible content
Data scope
We constantly extend our data scope. Depending on the data type, the scope may vary marginally. Currently, we cover the following data scope:
- Countries: Germany, United States
- Titles: All titles generally available
- Authors: All authors generally available
- Genres: Children's, Crime, Literature & Fiction, Mystery & Detective, Romance, Science Fiction & Fantasy, Teen & Young Adult, Thriller; all genres are limited to story-telling sub-genres, excluding, e.g., educational materials
- Genres hierarchy: We provide a three-level genre hierarchy that is adjusted to industry standards across providers and can be individualized in a Custom use case:
- Level 1, e.g., "Thrillers"
- Level 2, e.g., "Thrillers - Supernatural"
- Level 3, e.g., "Thrillers - Supernatural - Vampires"
- Data types: Publisher, author, author gender, title, topic, various success metrics, ratings, reviews, price, product variants, popularity (custom use cases include many additional data types depending on individual request)
- Sources: We collect data from dozens of sources including but not limited to major online shops, review communities, agent communities, individual publishers, distributors, agent and author pages, social media platforms, text aggregators, and industry associations.
- Updates: Data is generally updated once per month. Social Media data is updated continuously, aiming for weekly updates.
Data quality
Our data runs through an extensive quality control process. We capture all potential issues in an automated and reliable way. Issues addressed are constantly being updated, since we continuously increase our data quality further, dive deeper into the data and explore more use cases.
Common issues include misspellings (e.g., Stefen King), different ways of writing names (e.g., H. P. Lovecraft vs. HP Lovecraft), data gaps in our input sources (e.g., no price available), wrong data in our input sources (e.g., miss categorized: "The Gift" in "Gift books" instead of "Thriller"), and many more.
Data visualization
To give access to our data and visualize it, we use a tool called "Tableau"
Tableau is a well-established tool for precisely our purpose; it focuses on easy handling, a self-explanatory user experience, and provides a lot of helpful material.
We guarantee that everyone who can use a computer can use and understand Tableau.
Should you struggle - we are here to help, just shoot us a message.
Also, there is a lot of guided courses ranging from general introductions to solutions to specific problems available:
- Tableau's own education offering
- Introduction to Tableau on Datacamp
- Udemy overview of Tableau courses
- A variety of Tableau self-help videos on Youtube
Updates
- Updates are generally done on a monthly basis
- Updates imply a data pull from all available sources
- Updated data doesn't overwrite previous data but is appended to it, building a transparent timeline and adding value to the data
- Social media data is continuously updated, aiming for a weekly update circle
Success definition
- It includes a reader perception component that measures how well a book is received by the readership based on ratings and reviews
- It includes an approximation of actual sales based on price, number and value of ratings, reviews, bestseller list entries, and more
Start benefitting now, personally, and as publisher
-
Sold books
Start selling through the right bookfluencers.
-
Stop wondering whether or not bookfluencer marketing could be a way to go for your next titles or to reactivate your backlist. Stop guessing which influencers could reach the right audience with enough reach and engagement.
-
Start driving your book sales through hiring the right bookfluencers and track how impactful the investment was in order to optimize your selection continuously.
-
Robust decisions
Talk facts not fractual and individual perceptions.
-
Stop sharing individual opinions that are based on personal social media feeds influenced my personal web-behavior. Stop making business decisions based on the 5% of information you can manually collect in a realistic timeframe.
-
Start using current, complete, structured and searchable social media data to make your decisions. Form an educated opinion and then take robust decisions.
-

Time saving
Use the tool for 15 minutes instead of spending an hour on social media.
-
Stop randomly browsing social media platforms, trying to navigate them with poorly managed hashtags or video descriptions. Stop consuming irrelevant content in hopes of understanding trends, bookfluencers or finding author/title mentions.
-
Start targetedly working with tailored data that helps you to answer your questions. And then use our direct video links to consume only relevant content.